

A browser-based workbench for visualizing and analyzing NEXRAD (WSR-88D) weather radar data. It's written in Rust, compiled to WebAssembly, and runs entirely client-side: every fetch and computation happens in your browser, with no backend services. It's built on top of my NEXRAD crate suite.
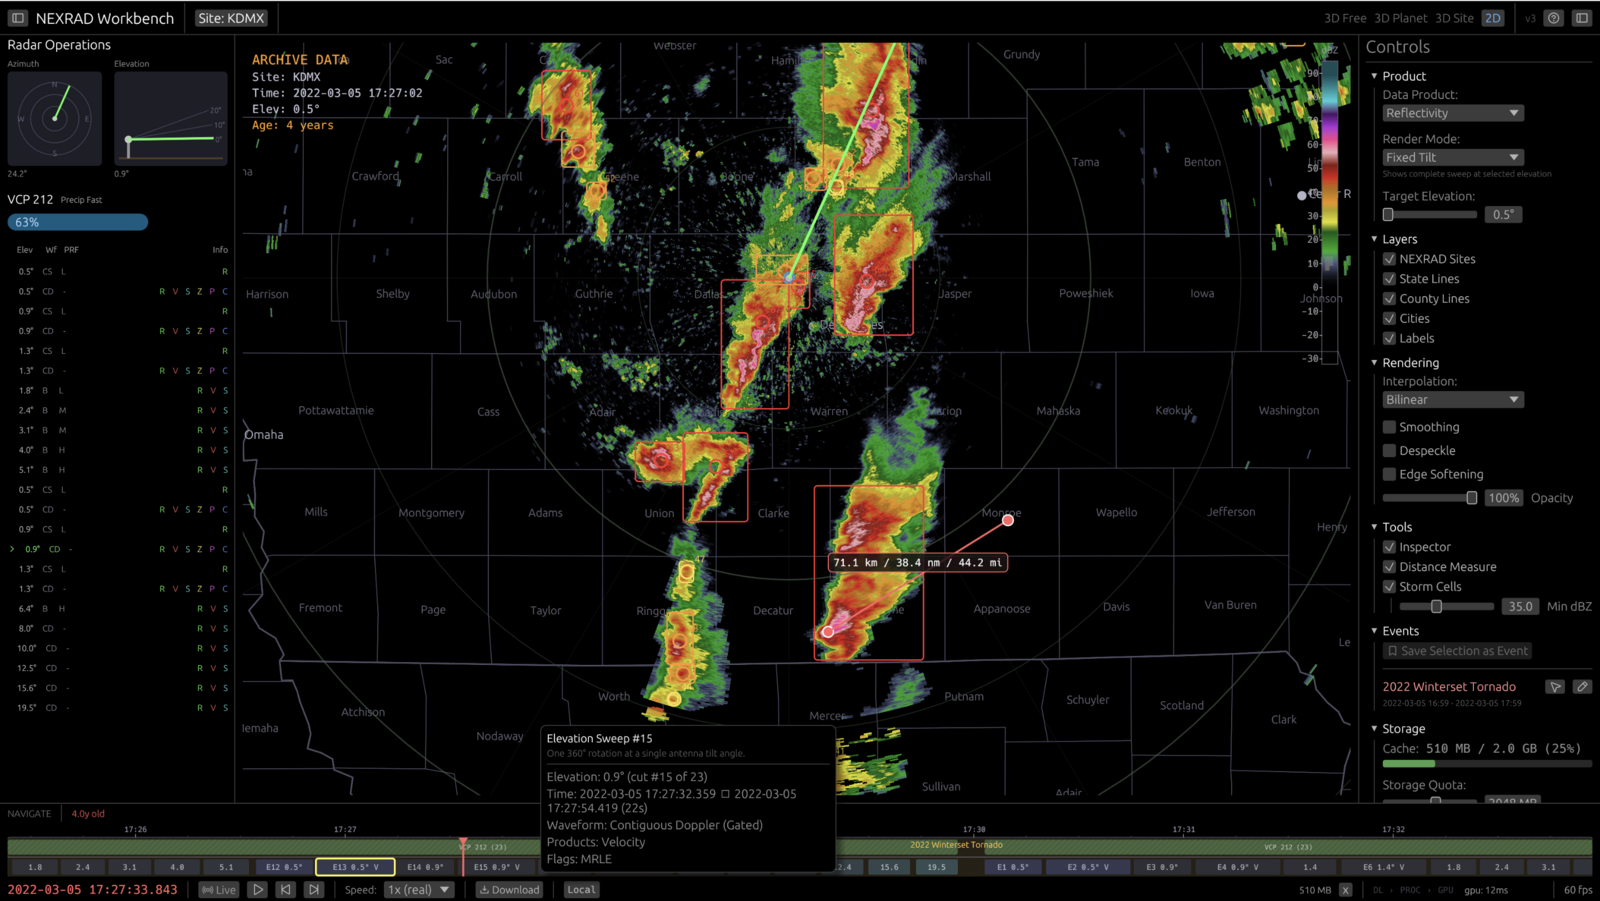
You can browse and download historical volumes from AWS S3 or stream live data as the radar produces it. A zoomable timeline visualizes data availability and supports scrubbing, range selection for batch downloads, and variable-speed playback. In real-time mode, playback locks to the leading edge of the incoming stream while still letting you scrub back through history.
All seven Level II products are available (reflectivity, velocity, spectrum width, differential reflectivity, correlation coefficient, differential phase, and clutter filter power), with an inspector for reading exact gate values, a distance tool, and configurable storm-cell detection that outlines cells and marks their centroids above a chosen dBZ threshold.
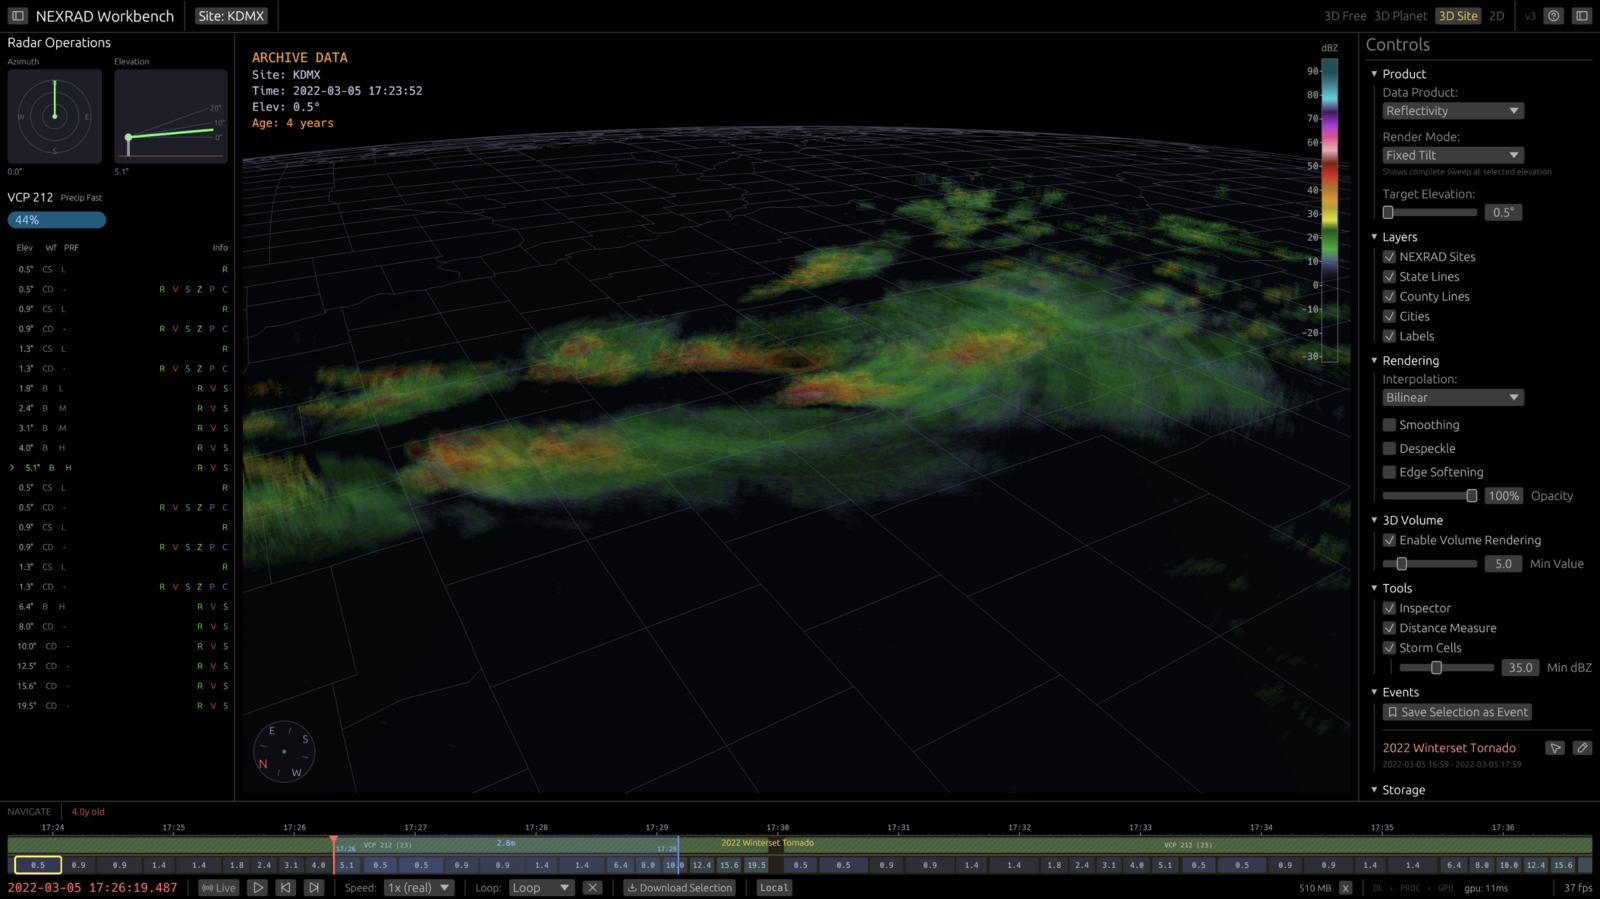
Beyond the 2D map, a 3D globe view ray-marches the stacked sweeps into a volumetric rendering of the storm. Under the hood it leans on egui for the UI and WebGL2 for graphics, and uses a "fat worker" architecture: heavy decoding and processing run on a dedicated Web Worker so the UI thread stays responsive, with decoded sweeps cached in IndexedDB for instant timeline scrubbing.